


Table of contents

No headings in the article.
I am sure you have heard the saying a dead man is a man who has stopped learning. everyday is an opportunity to learn something new, get hold of everyone you find at your disposal and grow through it. In the spirit of putting learning into practice, today I am going to be analyzing the FIFA data set which was gotten from data quest, the aim of the analysis is to show each player rating, their cities and wages, of highest paid players and their clubs.
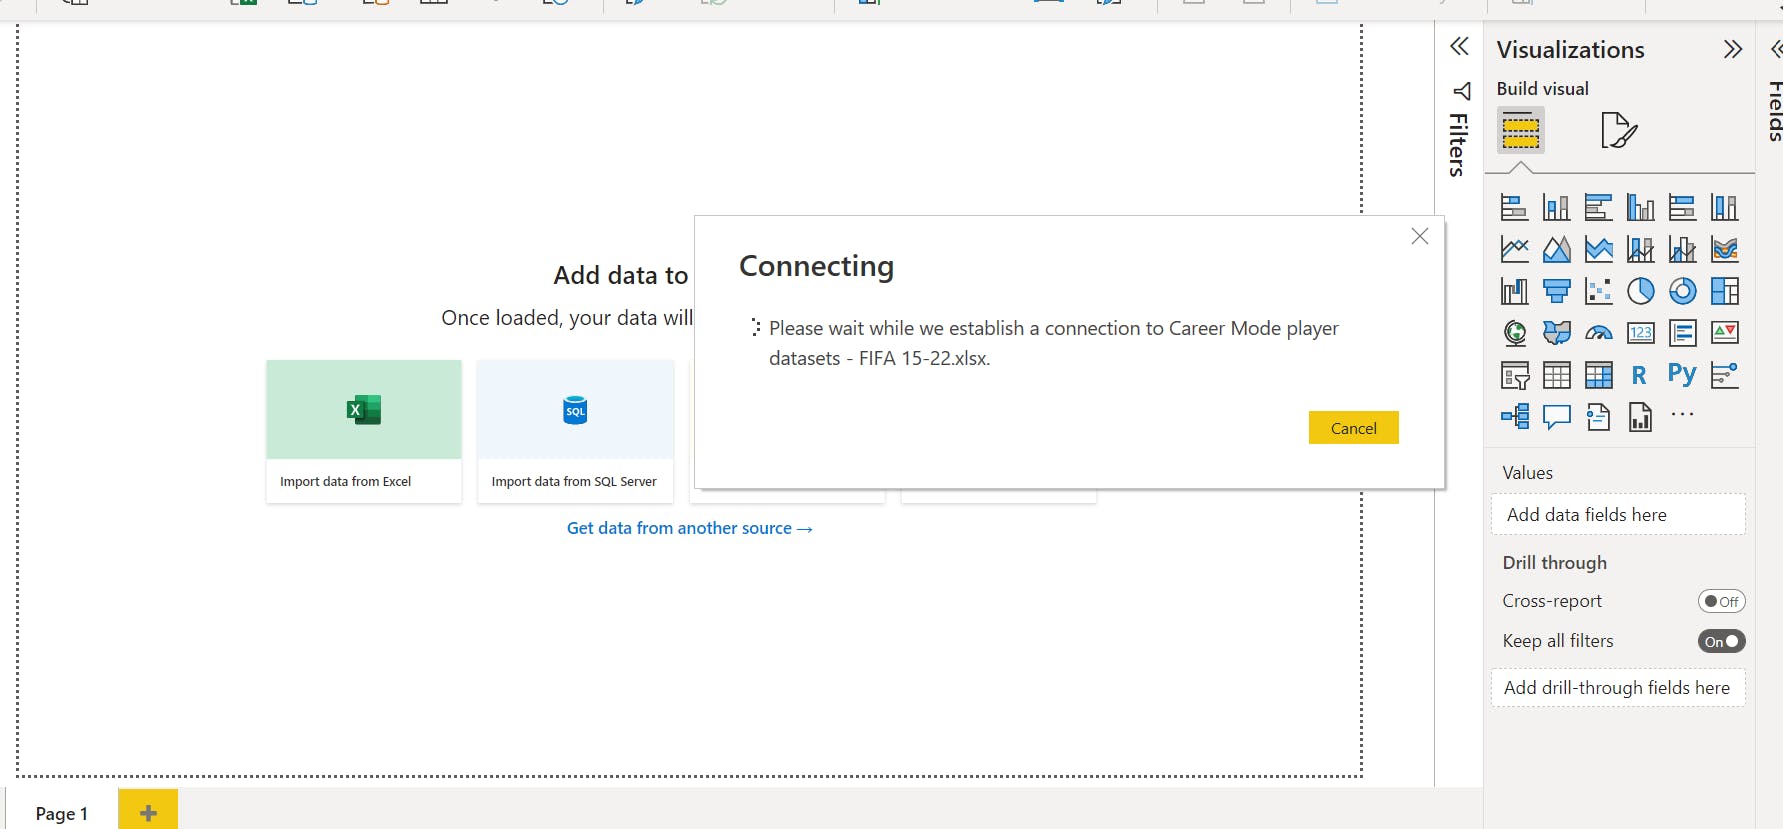
GETTING DATA I loaded the data into power BI using the import data from excel feature in power bi desktop I will be working with 2021 and 2022 data sets.
 DATA TRANSFORMATION
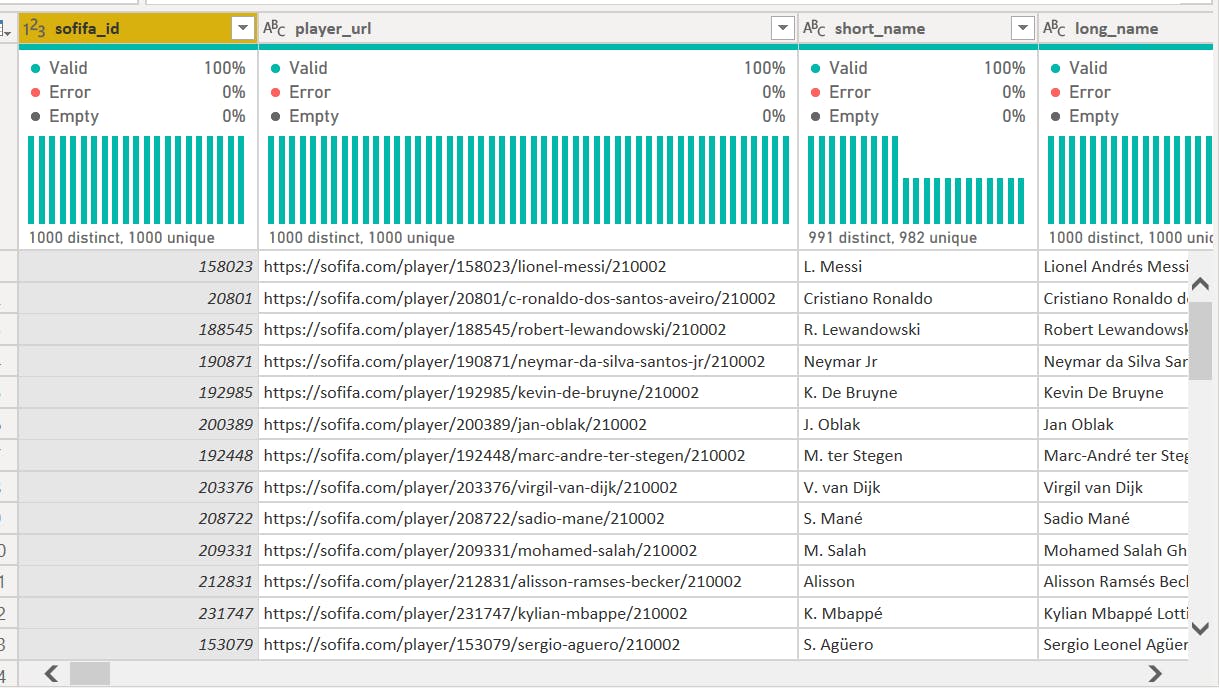
the data was then loaded into the power query editor by clicking transform data in the power bi desktop, for proper data cleaning, errors and empty columns were checked for, also I checked for the data type to make sure each data type corresponds with the data.
DATA TRANSFORMATION
the data was then loaded into the power query editor by clicking transform data in the power bi desktop, for proper data cleaning, errors and empty columns were checked for, also I checked for the data type to make sure each data type corresponds with the data.
 .
MERGING OF DATA
I later merged the 2021 data sets with the 2022 data sets to help in proper and accurate analysis,
.
MERGING OF DATA
I later merged the 2021 data sets with the 2022 data sets to help in proper and accurate analysis,
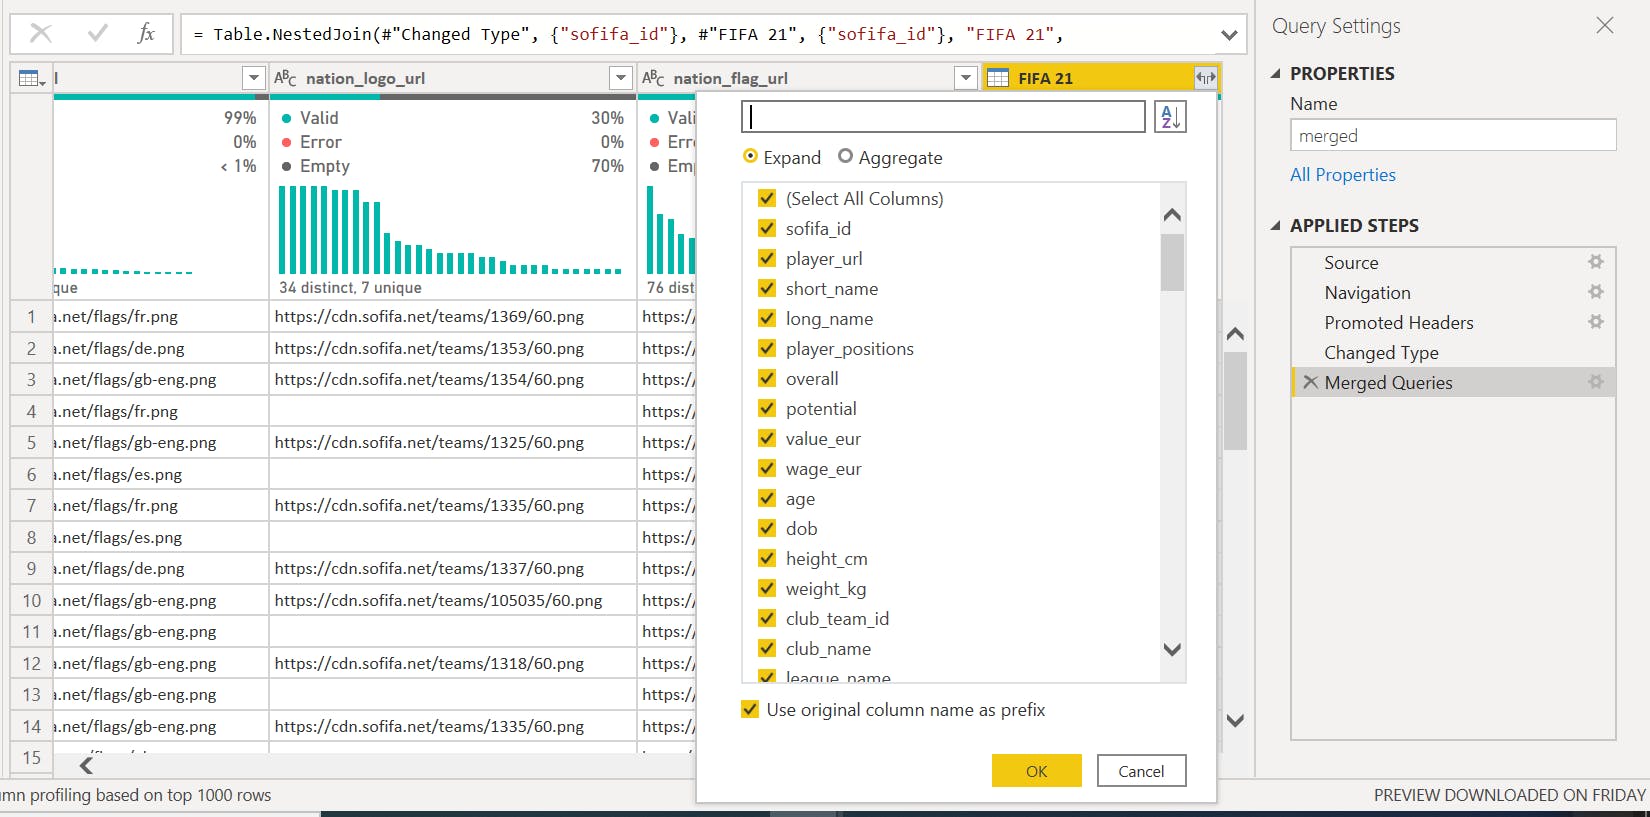
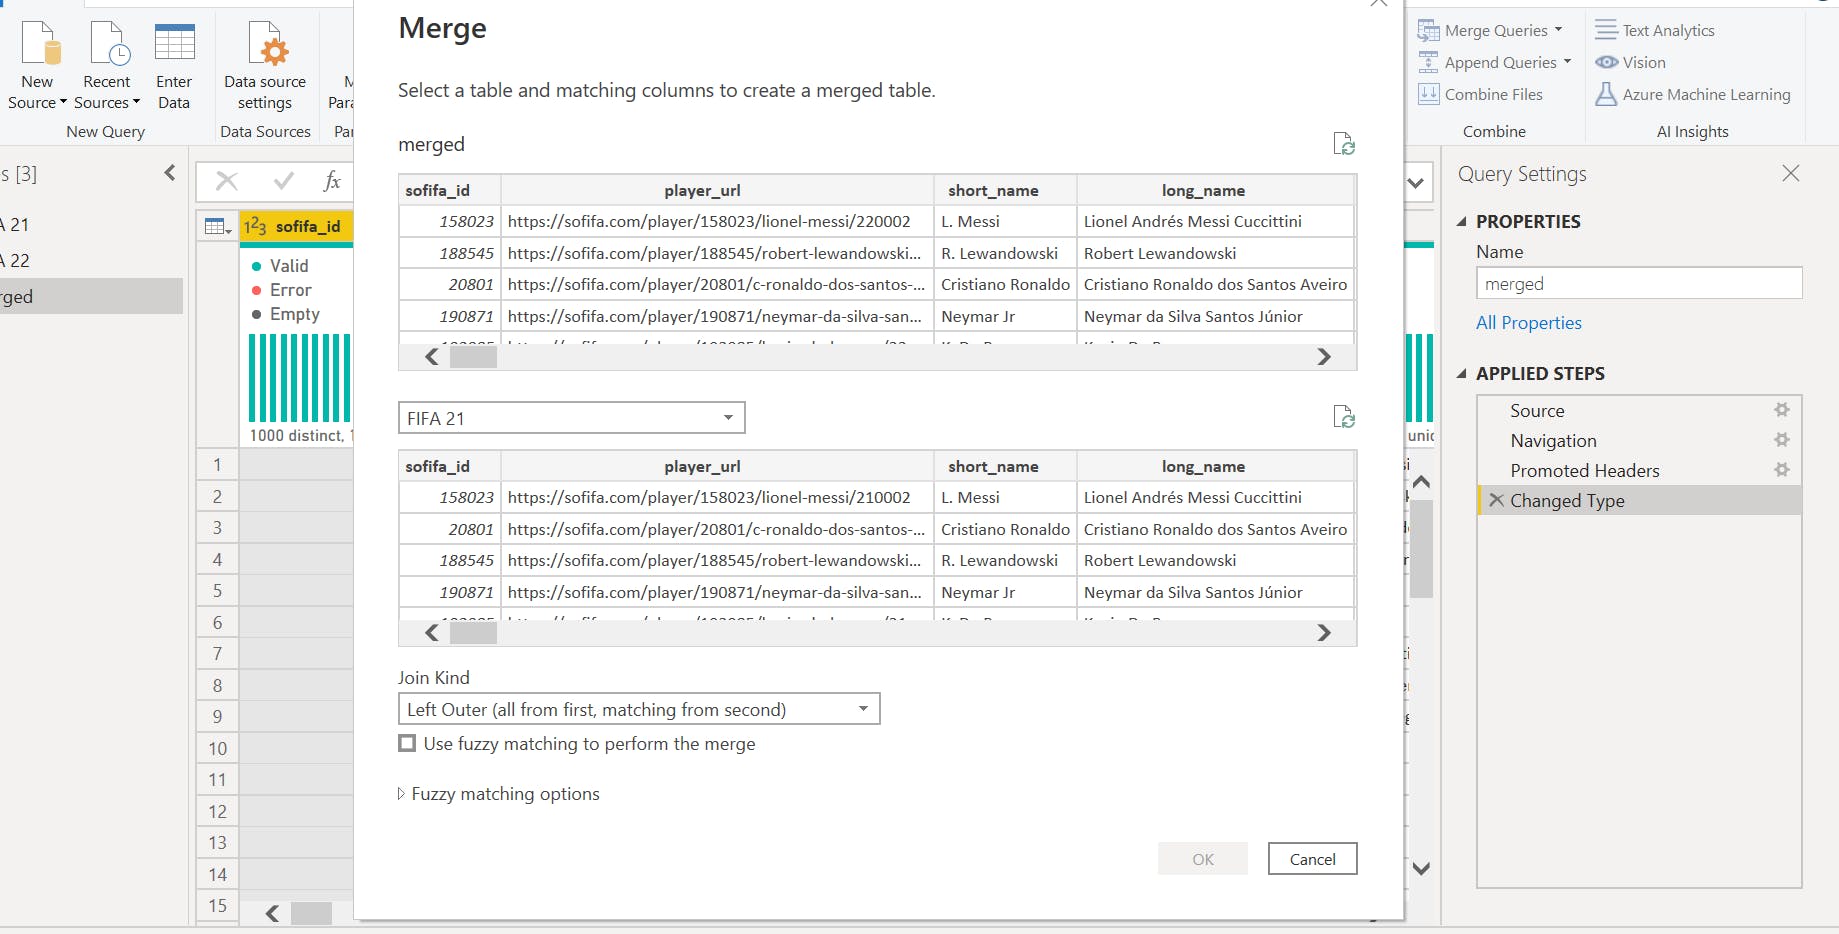 after merging the two data sets together I later went ahead to select the columns I want to appear in my 2021 data sets.
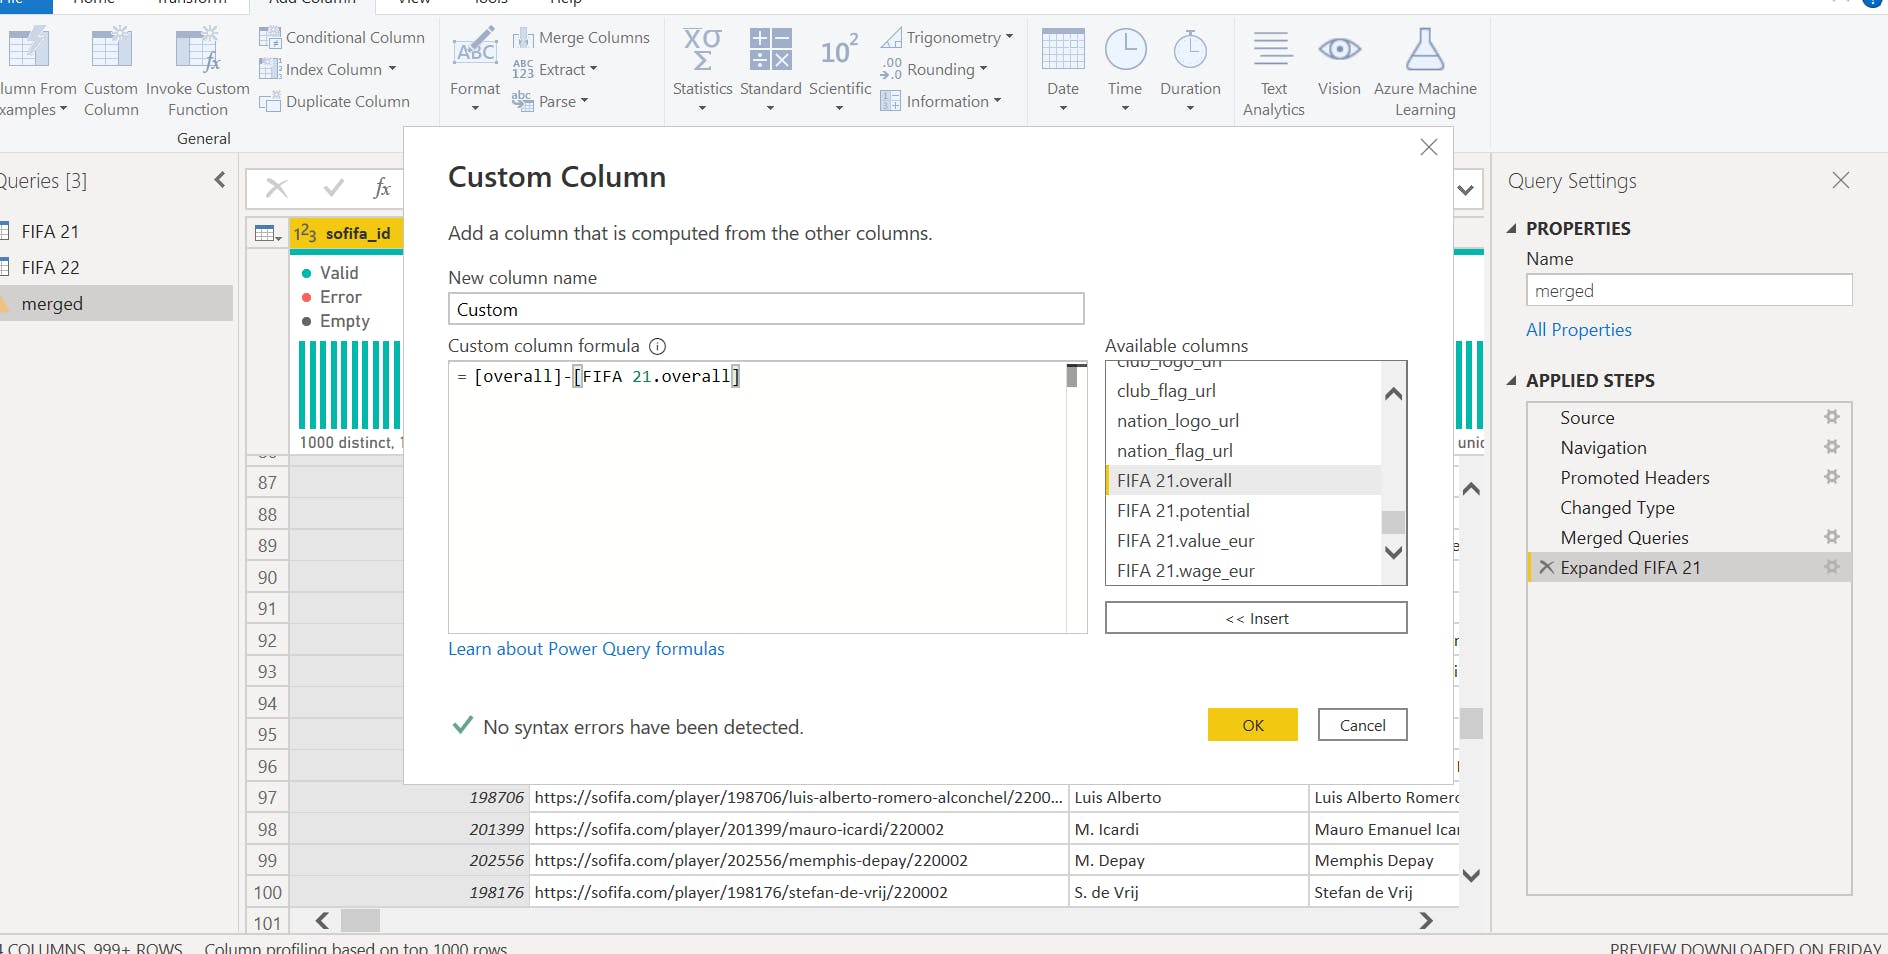
 CREATING OF MEASURES.
A measure was created in other to determine the wage difference among players between the both years
CREATING OF MEASURES.
A measure was created in other to determine the wage difference among players between the both years
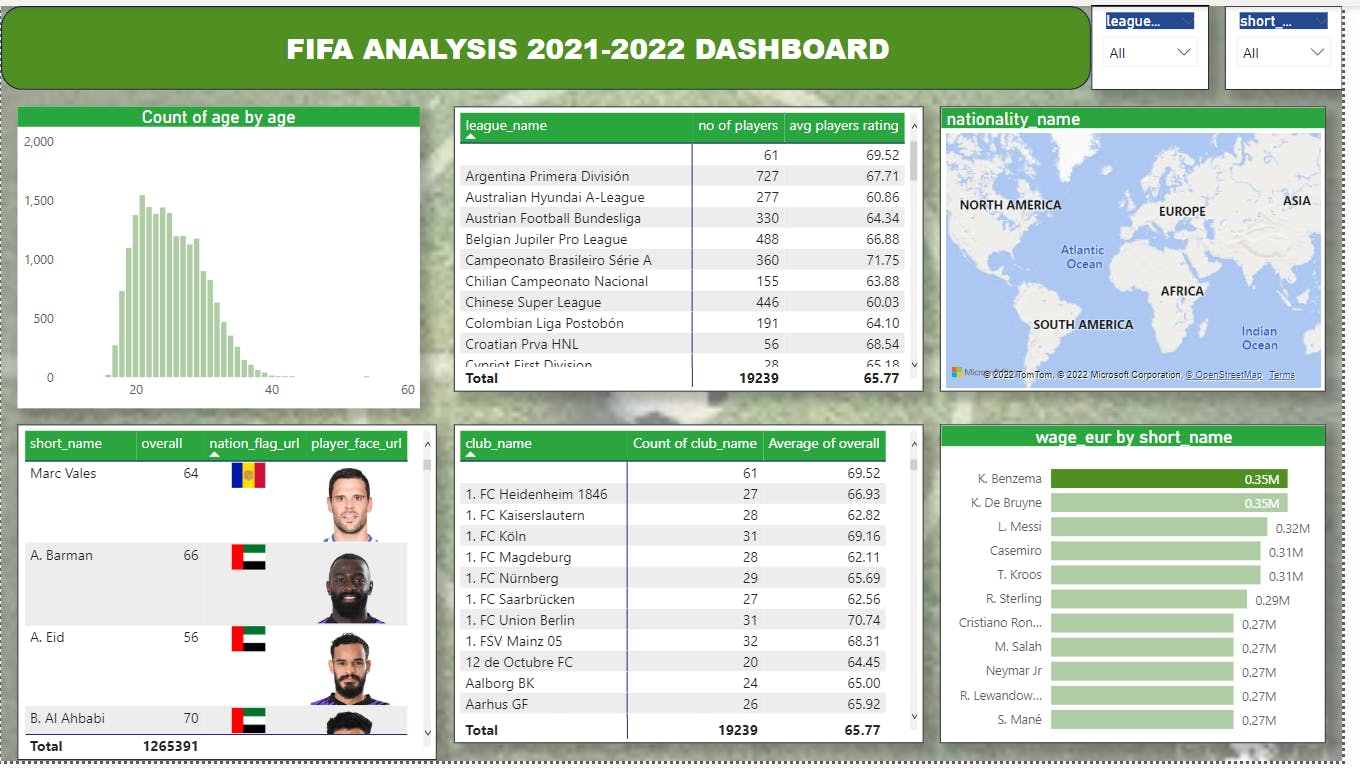
 PRESENTING REPORTS IN A DASHBOARD.
And finally the data set was analyzed using different measures and presented on a dashboard.
PRESENTING REPORTS IN A DASHBOARD.
And finally the data set was analyzed using different measures and presented on a dashboard.
NOTE: to get the images for the country flag, players face and club logo i used the data view on Powerbi desktop and click on the columns with the URL and click on data category choose image URL.
Thanks for your time I will keep you all posted on my journey.